Bruce Eastwood discusses it in Plinian astronomical diagrams in the early Middle Ages (1987) and returned to it in more detail in Planetary Diagrams - Descriptions, Models, Theories (2000, co-authored with Gerd Grasshoff, online) and Planetary diagrams for Roman astronomy in medieval Europe (2004, also with Grasshoff, online). If I am reading these articles correctly, the diagram is what the authors classify as "Plinian latitudes - rectangular" in their 2004 catalogue:
1 Avranches BM, 226, f.88r
8 Bern BB, 347, f.24v
10 Cambridge, St John's CL, lat. I.15, p.287
11 Cambridge, St John's CL, lat. I.15, p.353
12 Cambridge, Trinity CL, R.15.32, f.3v
13 Durham CathLibr, Hunter 100, f.66r
15 Erfurt StB, Ampl. 4°.8, f.1r
20 Genève FB, 111, f.41r
21 Glasgow UL, T.4.2, f.117r
22 Leiden UB, BPL 168, f.56r
24 London BL, Add. 11943, f.49v
27 London BL, Cott.Tib. E.IV, f.141r
32 London BL, Roy. 13.A.XI, f.143v (image in Eastwood/Grasshoff)
38 Milano BN, E.5 sup., f.1r
39 Milano BN, E.5 sup., f.53r
54 München SB, clm 6364, f.24v
57 Oxford BoL, Canon. Class. lat 279, f.34r
59 Oxford BoL, Lyell 154, f.26v
70 Paris BNF, lat. 5239, f.38v
71 Paris BNF, lat. 5239, f.39r
72 Paris BNF, lat. 6367, f.1v
79 St Gallen StiB, 250, p.2
81 Strasbourg BU, 326, f.122r
89 Vaticano BAV, Palat. lat. 1577, f.82v
94 Vaticano BAV, Regin. lat. 1573, f.53r
105 Wroclaw UB, IV.O.11, f.59r
108 Zürich ZB, Car.C. 122, f.42r
But perhaps I have not understood this correctly, since the specimen which is numbered Plin45 (clm 14436, 61v, link at the top of this blog entry) is absent from the above list, as is the specimen numbered as Plin83 in the 2004 article (Strasbourg, same codex as above, but folio 123r, reproduced in the 2000 article), along with six other references Eastwood gave in 1987:
Madrid 9605, f.12v
Zurich Car. C 176, f. 193v
Bern 265, f. 59r
London Cott.Vit. A XII, f. 9r
Baltimore Walters W, 73, f. 5v (mentioned in the note on page 11 of Eastwood's 2004 catalogue)
Oxford, St Johns, 17, f. 38r
London BL Eg. 3088, f. 83v
There is one corrigenda page in the Google Books edition, but these are not mentioned there. I do not know if further errata have been published. Perhaps I have overlooked some kind of filter that Eastwood and Grasshoff may have mentioned in their book, and I would be grateful if any reader could explain this to me.
Hans-Christoph Liess, supervised by Grasshoff and Eastwood during his doctoral studies at the University of Berne, later assembled a database of Eastwood's images, and published a description. The title page of this 2001 database project, code-named Compago, is still online, as is the diagram index page, and, perhaps most important, an interactive mind-map of the manuscripts listed above. A handbook was also published. But the back end with the actual images and the required software module, code-named Alcatraz, seems to have either been taken down or to have been put behind a wall. Google Chrome is able to open the interface, but a user name and password are required to proceed further. Liess completed his doctoral dissertation in 2002 (large file) and this is online. Both Liess and Grasshoff have since moved from Berne to Berlin.
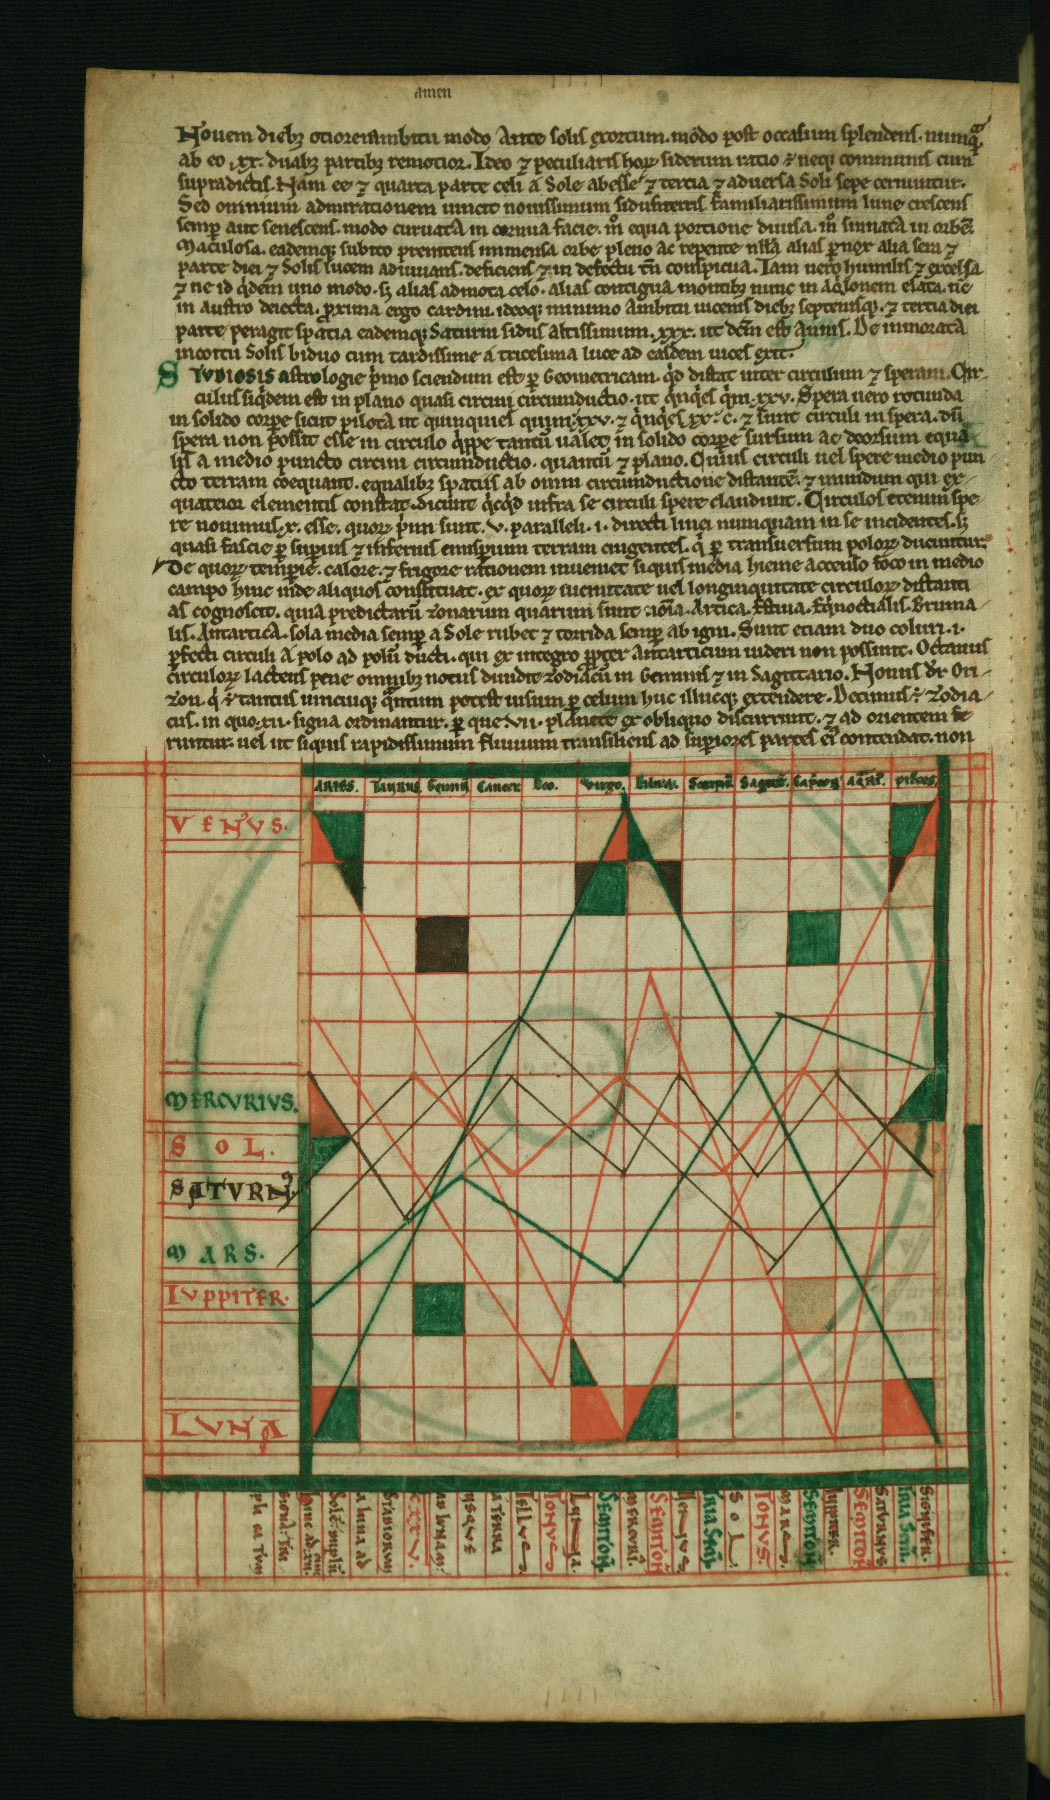
What is curious is that all three authors are sure that the diagram is a simplification of a circular diagram of the Plinian latitudes which is found in 12 manuscripts. Pliny had presented the data as numerical data only. Then a Carolingian editor devised the circular diagram just before or following a conference on computus in 809 EC and "solved the problem of presenting to students the spatial meaning of the Plinian text" (Eastwood, 2000). Eastwood and Grasshoff continue:
Within a few decades after its creation, the circular latitude diagram was replaced by another, a rectangular diagram, which reduced the amount of theoretical content added to the relevant Plinian text and also offered a more easily produced and more quickly read image.Edward Tufte reproduces the Munich rectangular diagram on page 28 of Visual Display of Quantitative Information, but curiously enough misses its significance for the history of simplification. He only cites an outdated 1936 article by Funkhouser on it. In fact, the diagram turns out to be exemplary of Tufte's principles of subtracting and simplifying to make graphics clearer and more communicative, and his term "reduction of data ink" to describe economy in an infographic:
A few graphics use every drop of their ink to convey measured quantities.


No comments :
Post a Comment